
Birth Injury Statistics

Sam Uribe. Author
When it comes to birth injuries, statistics are much more alarming than you might think. Read below for more information about birth injury statistics and data gathered based on a variety of factors.
We live in a time when parents are allowed to be caretakers for their own disabled children. However, we also live in a medical age when we are constantly working to learn about medical conditions. As it turns out, several disabilities are the result of birth injuries, or instances of medical malpractice during birth that transform a normal child to a disabled child only from one mistake.
With this knowledge comes responsibility, and parents are more now than ever expected to become advocates for their children. Part of that is knowing what to look out for so that some birth injuries can be prevented.
General Birth Injury Statistics
Of every 1,000 infants born in the United States, 6 to 8 of them are born with a birth injury. That means that approximately 1 in every 9,714 people in the U.S. are born with a birth injury.
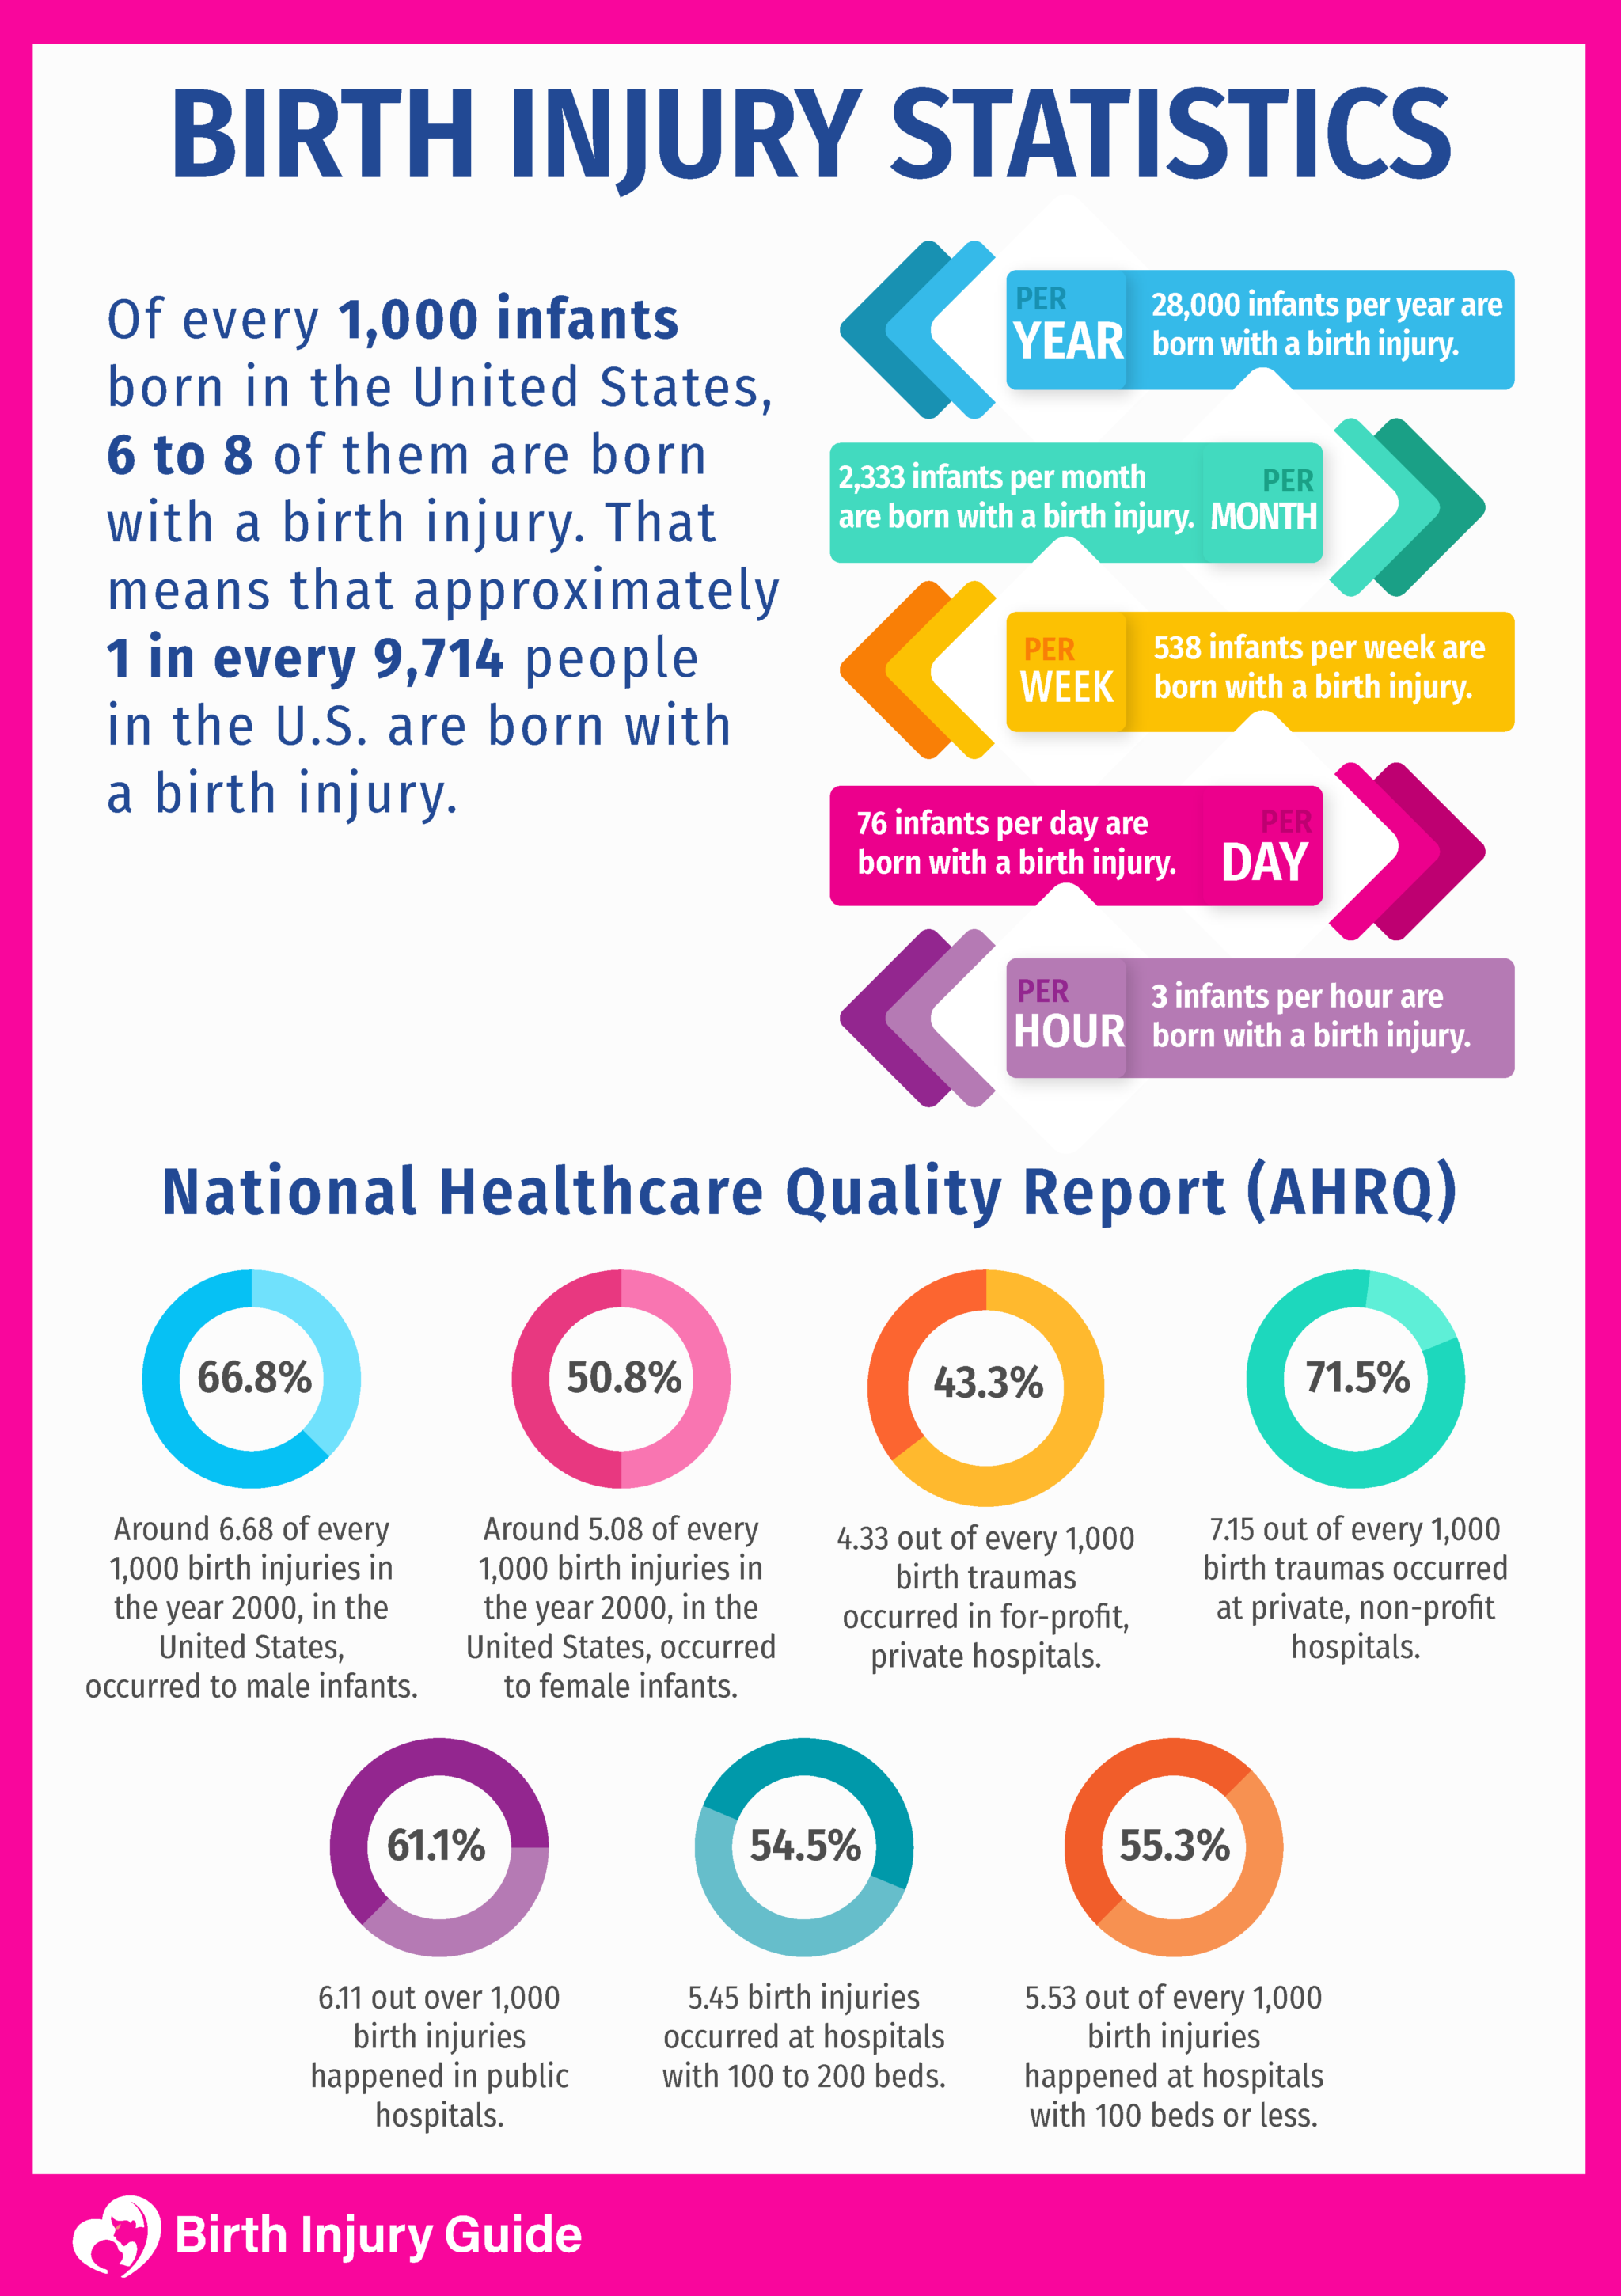
According to the National Healthcare Quality Report (AHRQ), around 6.68 of every 1,000 birth injuries in the year 2000, in the United States, occurred to male infants, whereas 5.08 of every 1,000 birth injuries happened to female infants. In the same year, 4.33 out of every 1,000 birth traumas occurred in for-profit, private hospitals and 7.15 out of every 1,000 birth traumas occurred at private, non-profit hospitals.
In addition, AHRQ states that 6.11 out over 1,000 birth injuries happened in public hospitals, 5.53 out of every 1,000 birth injuries happened at hospitals with 100 beds or less, and 5.45 birth injuries occurred at hospitals with 100 to 200 beds.
Most Common Birth Injuries
The 10 most common birth injuries include:
- Brachial Plexus Injury
- Hypoxic Ischemic Encephalopathy (HIE)
- Broken Bones
- Cephalohematoma
- Caput Succedaneum
- Intracranial hemorrhage
- Subconjunctival hemorrhage
- Spinal cord injuries
- Cerebral Palsy
Data Involving Mothers
Birth injuries are highest for mothers with birthing tool-assisted deliveries from ages 25-34, and lowest in mothers who range from 40-54. However, the birth injuries for mothers delivering non-instrument assisted vaginal births is only high for ages 25-29.
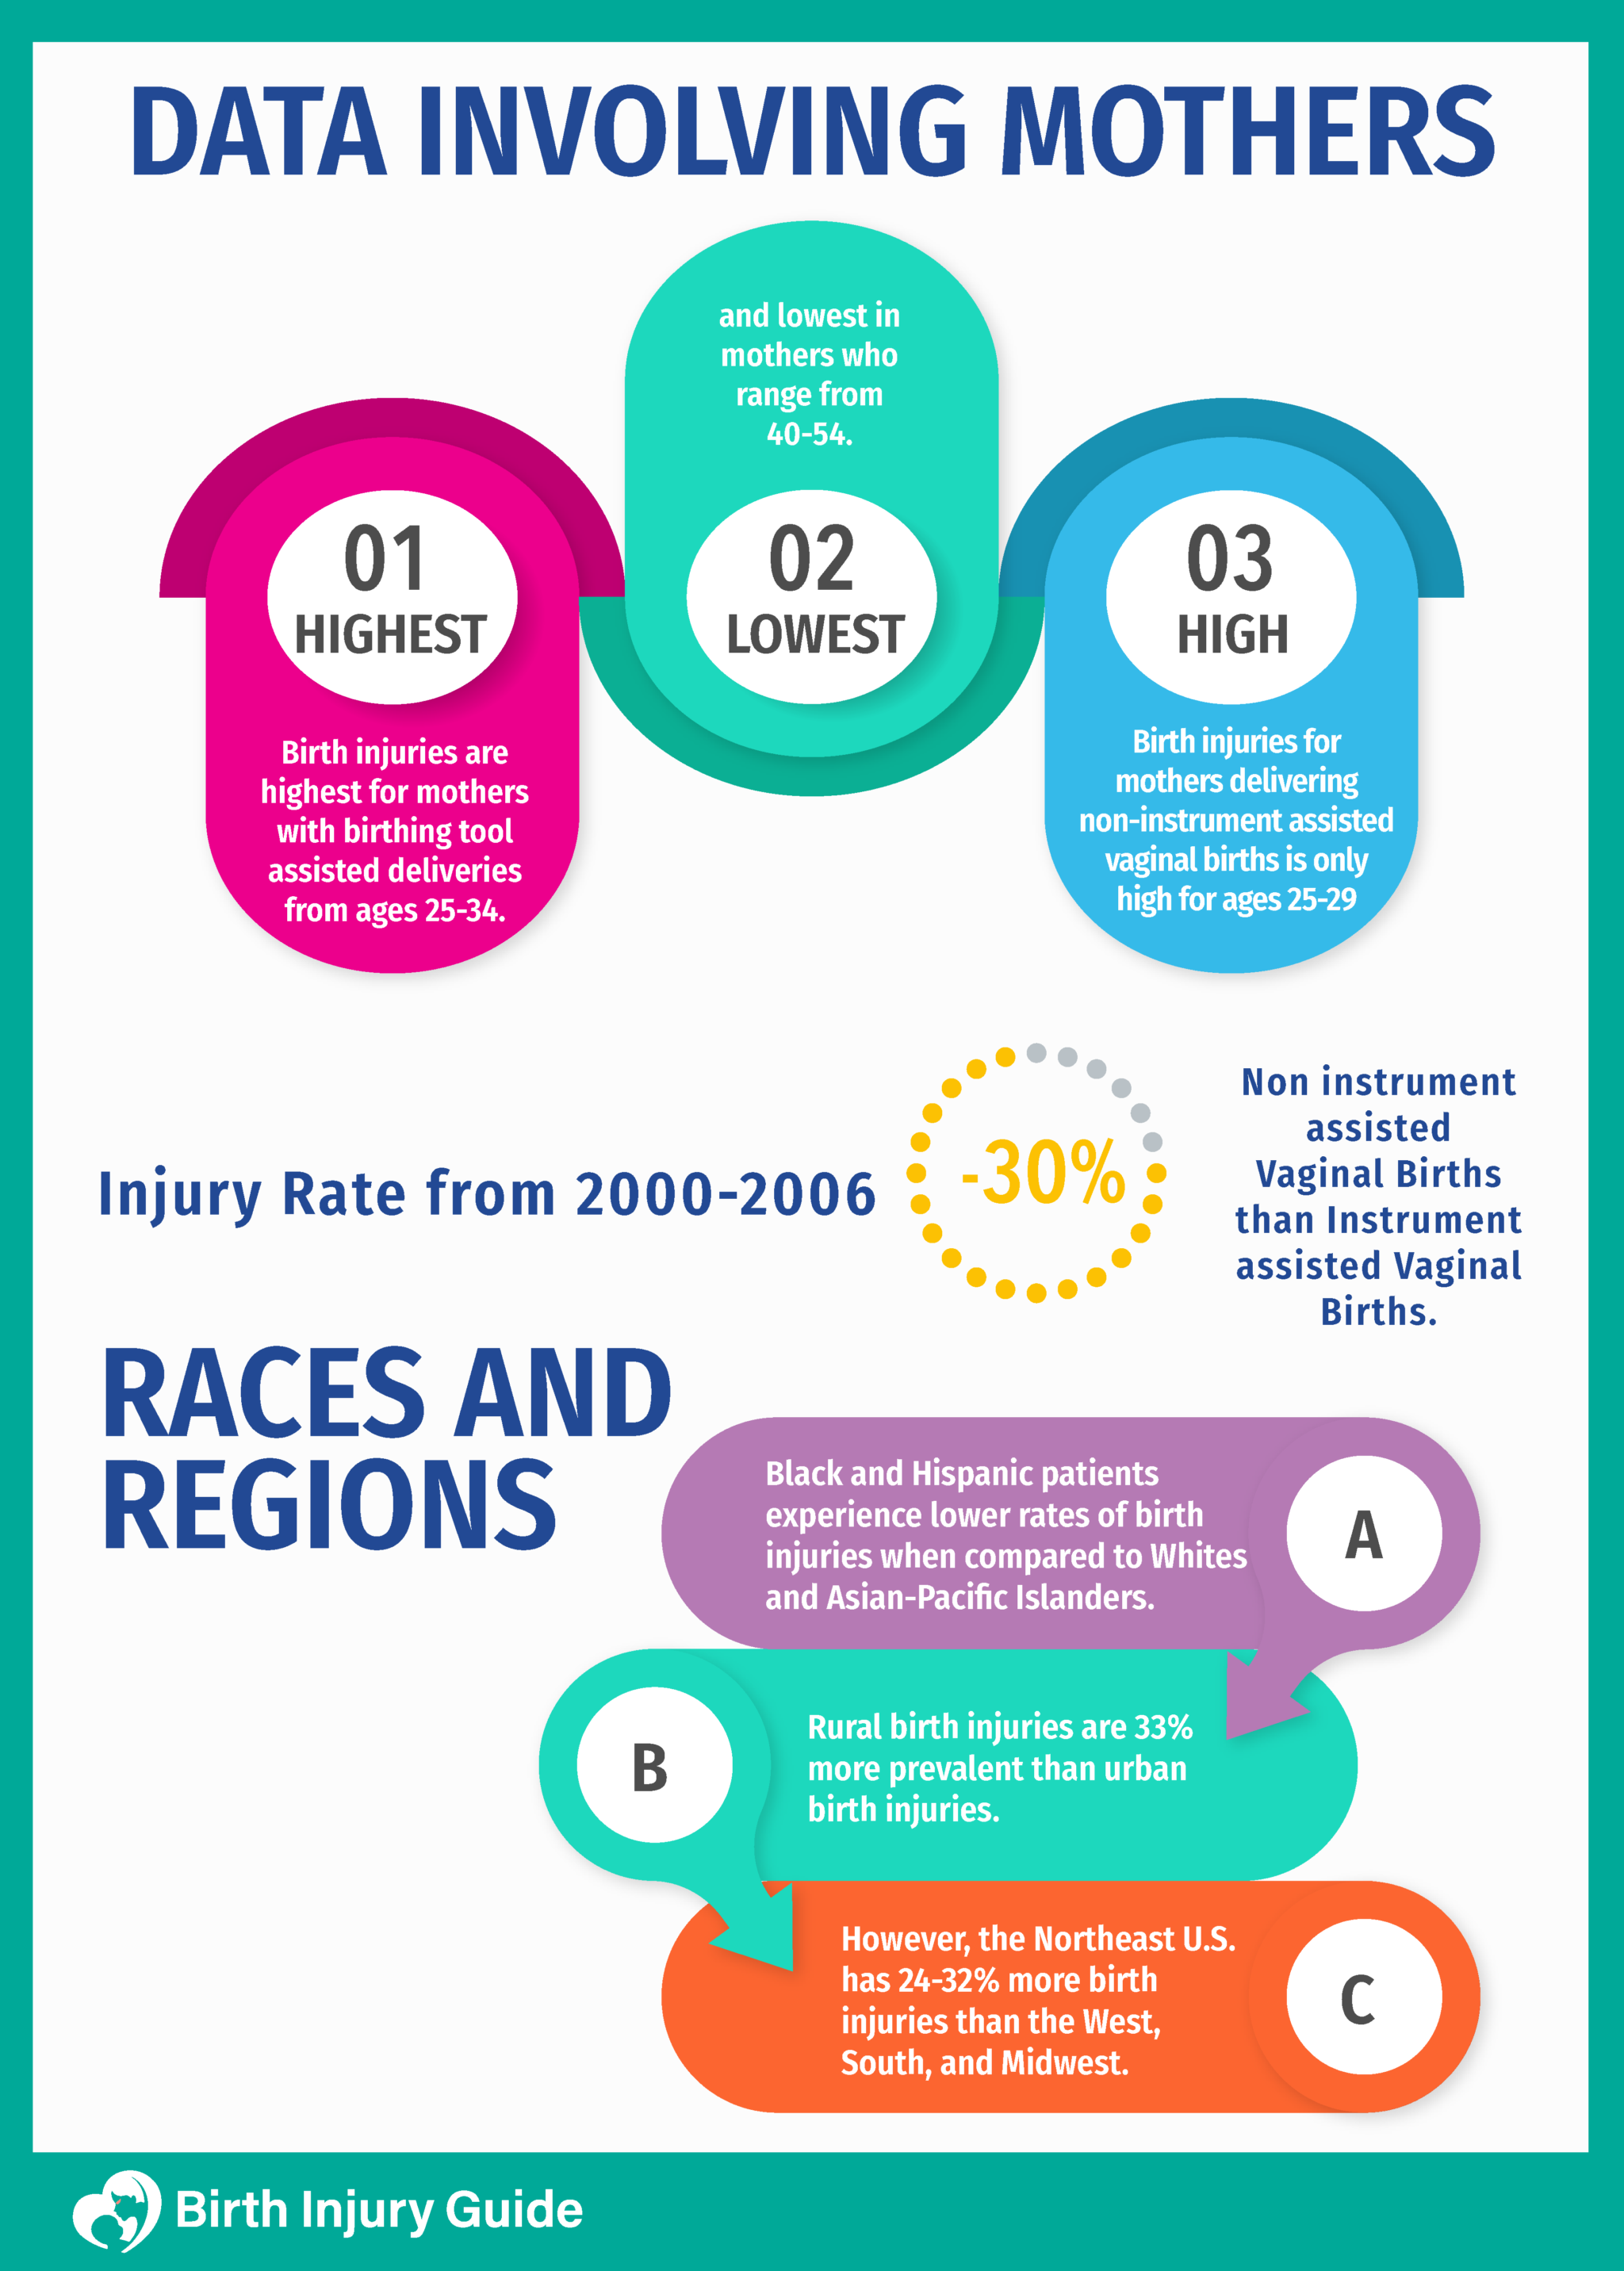
In fact, from 2000-2006, injury rate for mothers in non-instrument-assisted vaginal births is 30% less than the injury rate for mothers in instrument-assisted vaginal births. Injury rates of trauma occurring during cesarean section increased with the mother’s age, though a cesarean section is generally accepted as the safest form of delivery. Mothers with Medicaid or uninsured patients were less likely to experience birth injuries than mothers with private insurance.
Races and Regions
Black and Hispanic patients experience lower rates of birth injuries when compared to Whites and Asian-Pacific Islanders. Rural birth injuries are 33% more prevalent than urban birth injuries. However, the Northeast U.S. has 24-32% more birth injuries than the West, South, and Midwest, including both birth injuries to newborns and instrument-assisted trauma to mothers.
The Bottom Line
In 2006, nearly 157,700 injuries to mothers and newborns could have potentially been avoided. Close to 50% of all birth injuries are potentially avoidable by identification and planning for obstetrical risk factors. Birth injury statistics like these are more than alarming. This information illustrates just how deadly medical negligence can really be.
Start Your FREE Case Review Today
If you or your child is injured as a result of medical negligence, call us to learn more.
Sam Uribe is a researcher and writer. She lends her expertise to the team at Birth Injury Guide to provide up-to-date and relevant content that clients can count on.